Prometheus
Cloudders Health Check operator exposes by default Prometheus Metrics.
Our helm chart creates Prometheus Operator
ServiceMonitor resource by default in the monitoring namespace.
If the prerequsites are met and the ServiceMonitor is enabled in the helm chart here.
Prerequisites
You need to have kube-prometheus-stack installed on your cluster.
The installation is quite simple if you follow the guideline in their installation section of the helm chart readme.
Exposed metrics
The operator exposes the following metrics:
healthcheck_response_codes:counter- This iscountertype of metrics for theHTTPreponse codes received by theHealthCheck. In case a differentresponse codeis received a new time seriescounterwill be created for thisresponse codehealthcheck_response_time:gauge- Thisgaugeis for theHealthCheckresponse time. Its measured in milliseconds.healthcheck_status:gauge- Thehealthcheck_statusgaugerepresent1if the target of theHealthCheckisUPand0if the target isDOWN.
Understanding the labels
The following labels are exporter for the metrics:
name: this is the name of theHealthCheckCRD (available for all metrics)code: response code of the target (only available for thehealthcheck_response_codesmetrics)
Exploring the metrics
You can query the Prometheus service endpoint with cURL to explore the metrics exposed by the Operator, or via port-forwarding, if you haven't exposed the Prometheus UI outside your cluster.
cURL method
To get the Prometheus metrics you can execute the following commands, assuming that your Prometheus operator is installed in the monitoring namespace.
kubectl port-forward svc/prometheus-kube-prometheus-prometheus 9090:9090 -n monitoring
and in a new shell you can cURL the endpoint with the following command:
curl -X POST http://localhost:9090/api/v1/query\?query\="healthcheck_status"
Prometheus UI
The Prometheus UI provides user friendly way to query metrics, explore targets, see current alerts from the operator.
To access the UI if you haven't exposed your Prometheus you can simply type this command:
kubectl port-forward svc/prometheus-kube-prometheus-prometheus 9090:9090 -n monitoring
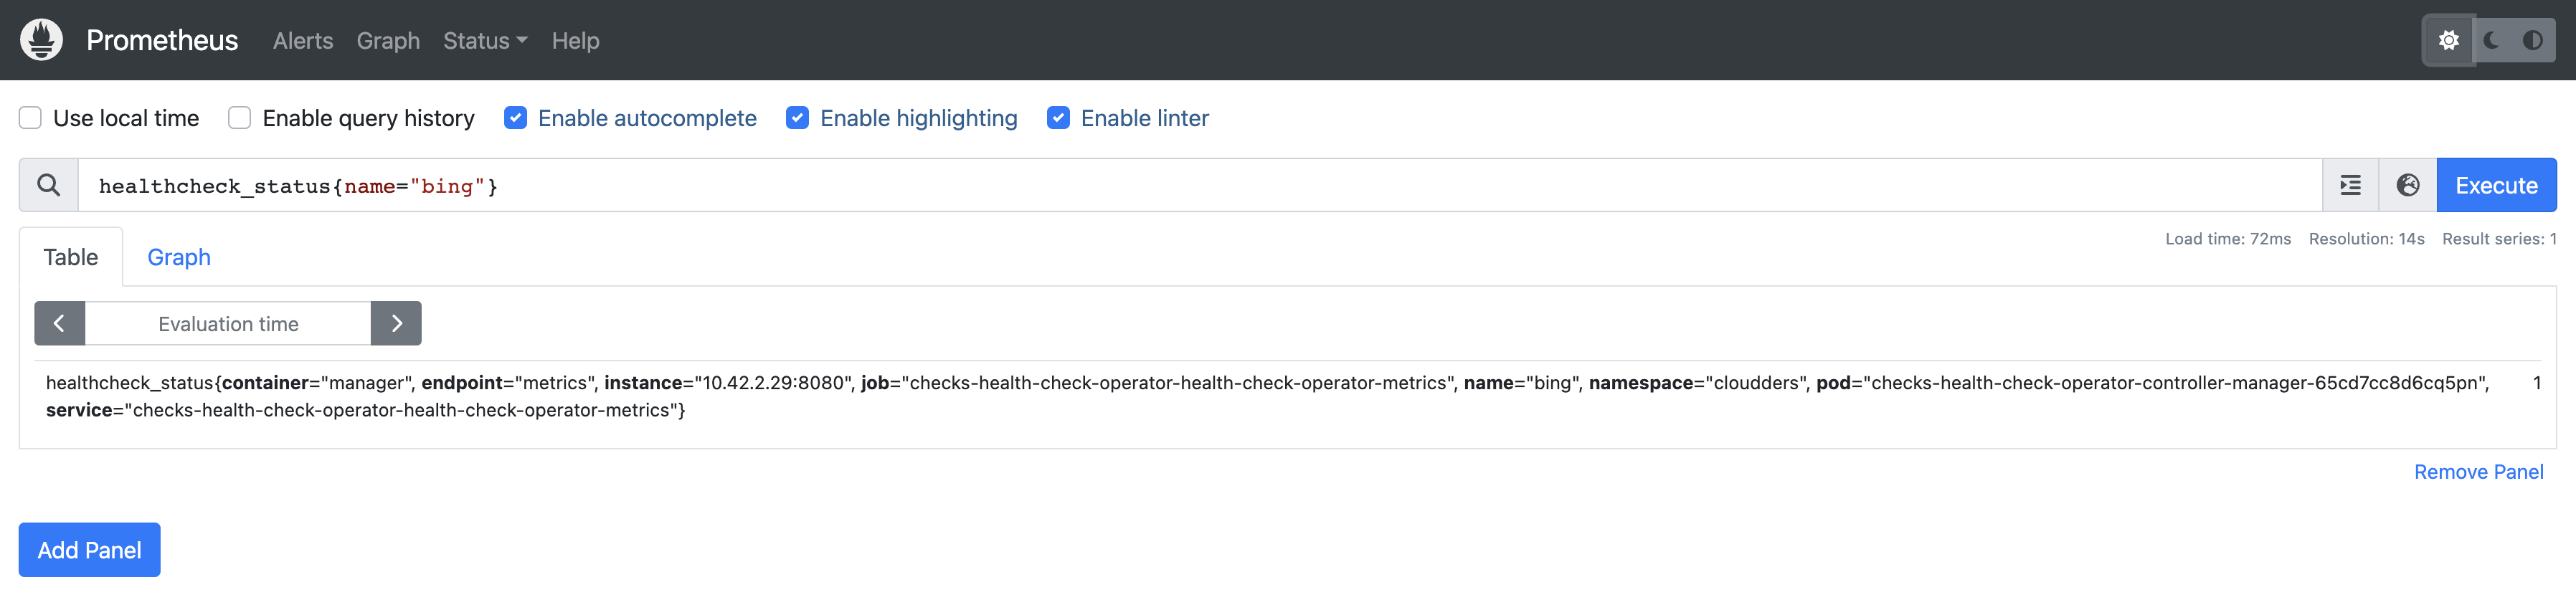
Navigate your browser to the following URL: http://localhost:9090 - this assumes your Prometheus does not run over SSL.
You can now query the metrics from the Graph section of Prometheus like on the following screenshot:
Troubleshooting
Here you can find some troubleshooting guides, if the metrics are not exposed via the ServiceMonitor target.
ServiceMonitor
Make sure your have setup the serviceMonitor configuration in the helm chart.
There are two important parameters:
namespace: the namespace where the Prometheus is installed, if you are not scanning all namespaces forServiceMonitorresources.prometheusReleaseName: this is the name of thehelmrelease of yourkube-prometheus-stack.