
· 4 min read

As the Kubernetes ecosystem continues to evolve, Cloudders remains aware and tries to innovate, consistently delivering features that enhance your Kubernetes experience. We are thrilled to introduce significant new enhancements to our Kubernetes Health Check Operator—an indispensable tool for DevOps teams overseeing Kubernetes deployments.

Major Upgrades in v0.4.0

Our latest release, v0.4.0, is packed with powerful new features and enhancements designed to make your Kubernetes health checks more robust and insightful.

Backoff Mechanism

Managing rate limits can be challenging, especially when health checks are performed frequently. With our new backoff mechanism, the operator intelligently adjusts the interval between health checks if a 429 Too Many Requests response is encountered. This backoff mechanism helps to avoid overloading your services and ensures compliance with rate limits.

REST API Implementation

We understand the importance of real-time visibility into the health status of your services. That’s why we've implemented a REST API that exposes the health check statuses in JSON format. This API allows developers to integrate health check data seamlessly into their applications, providing better insights and automated responses to service health changes.
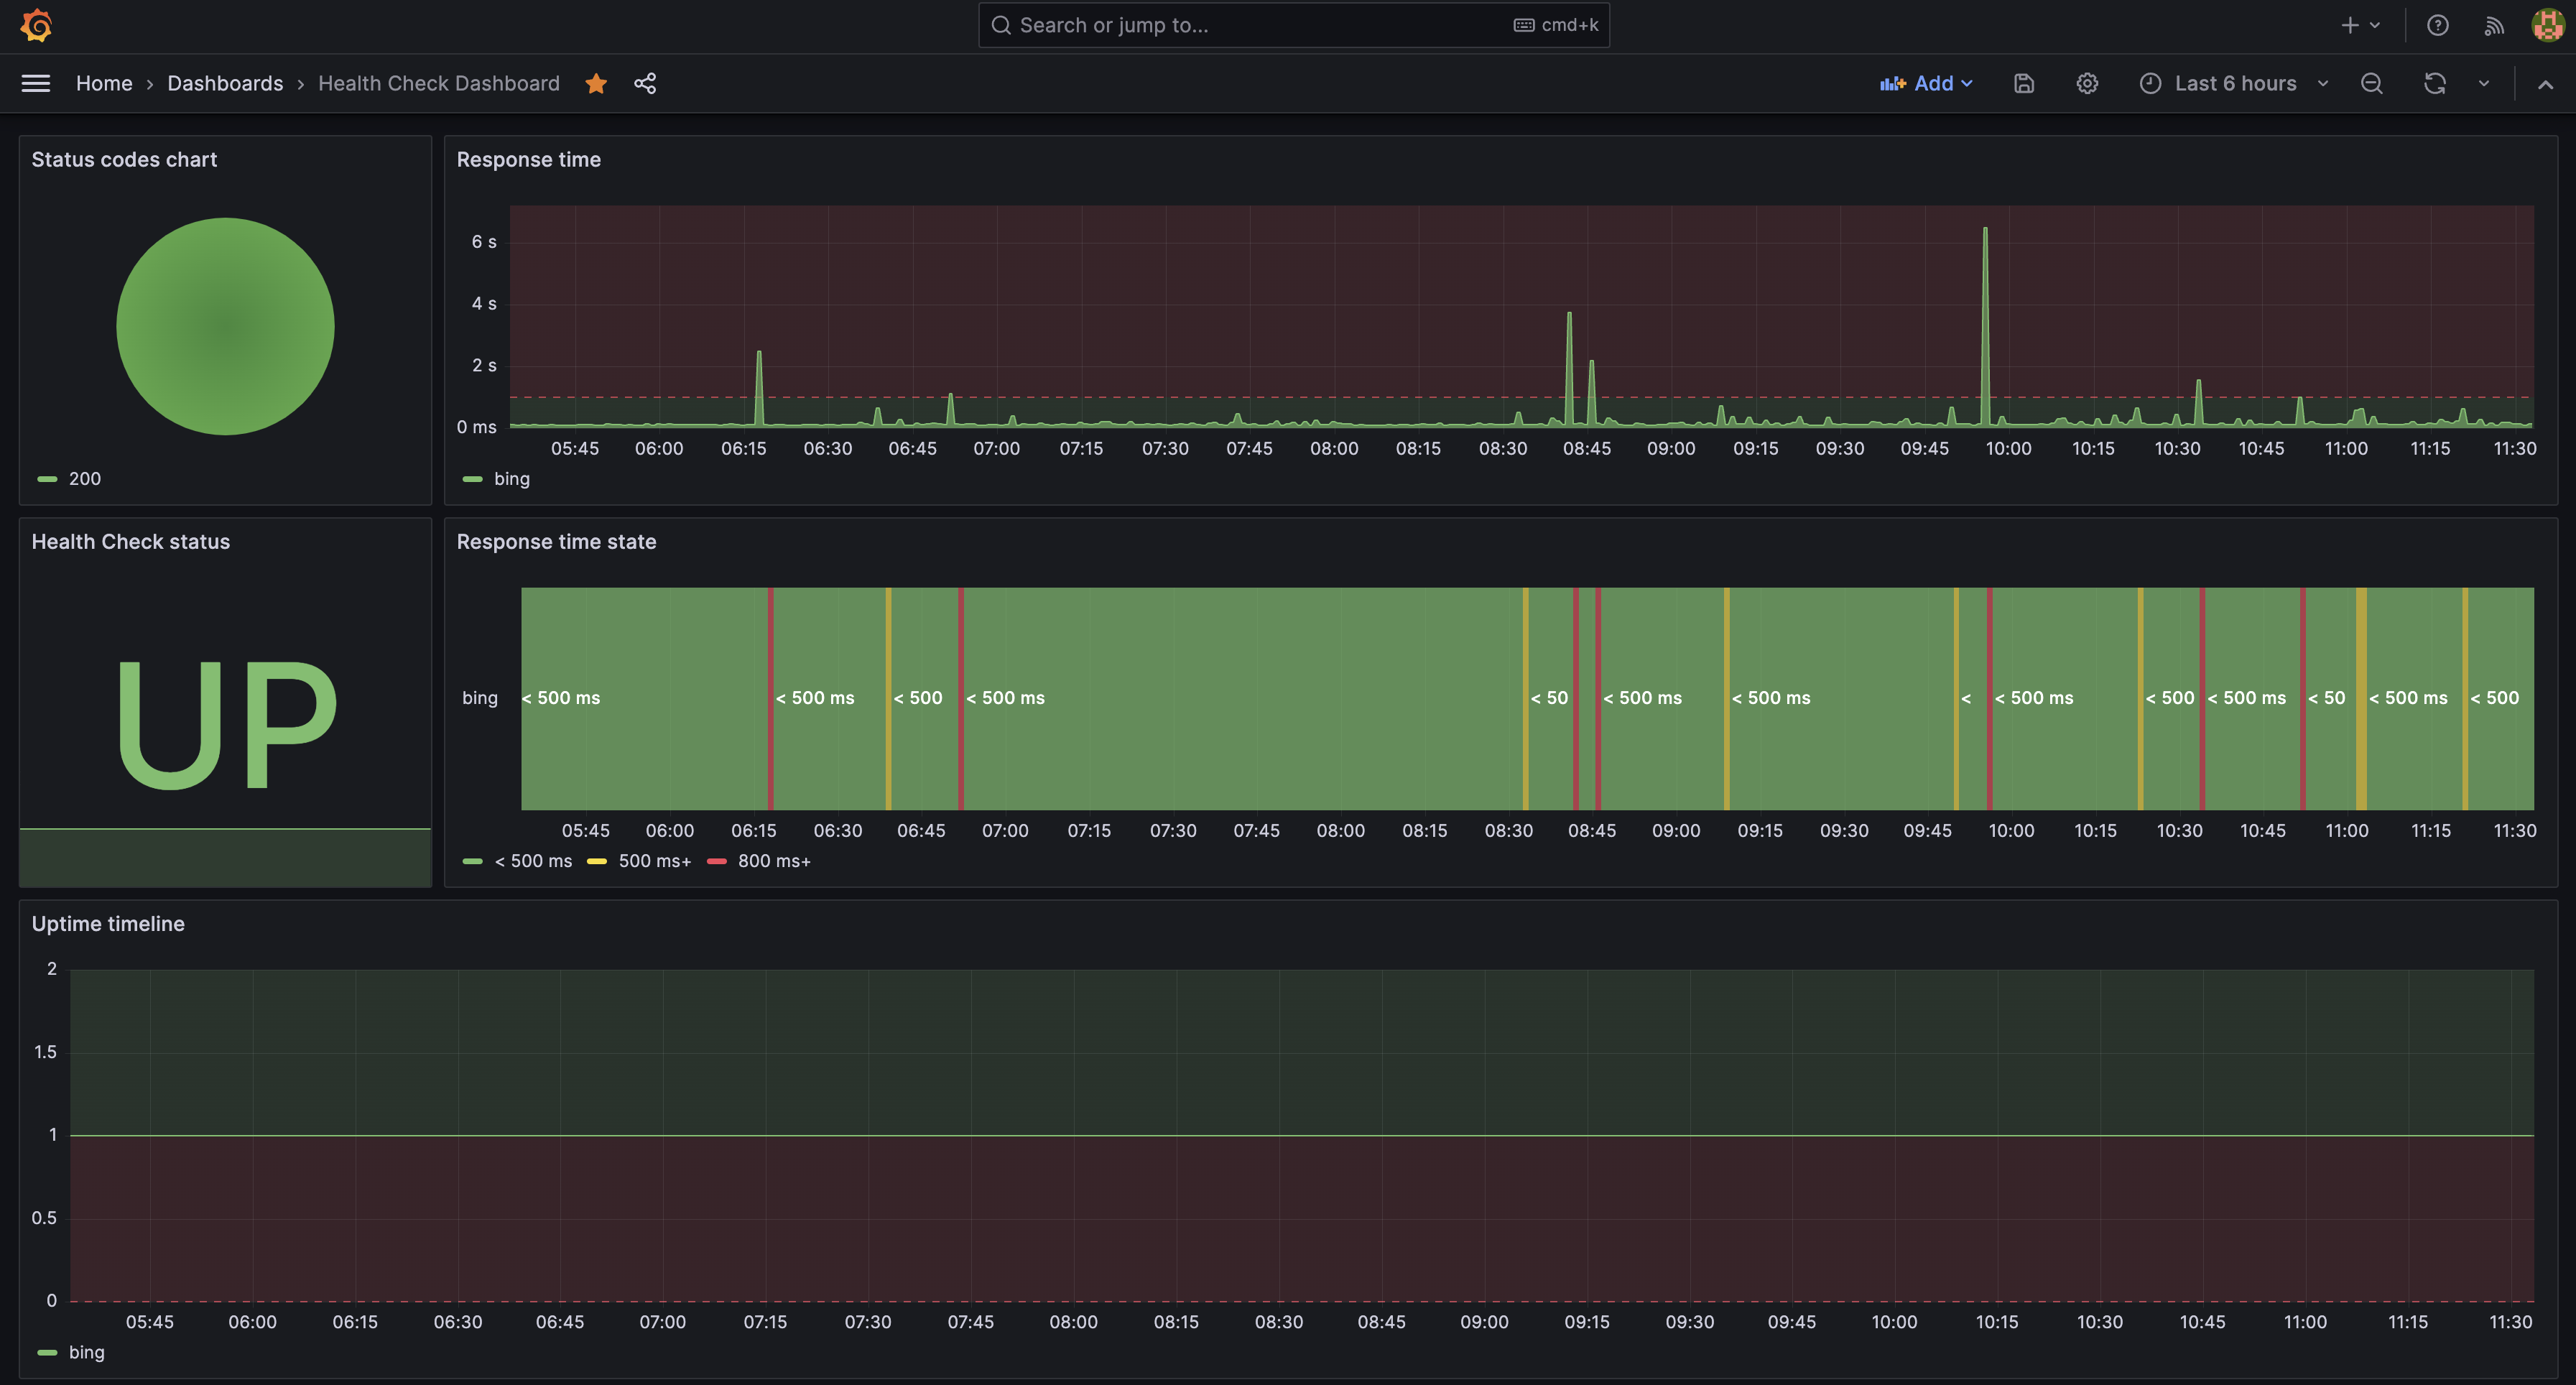
Check State

To provide clearer insights into the status of your health checks, we've introduced a new State field in the health check status. This field can have one of the following values:

  • Active: The health check is running normally.
  • CheckBackoff: The health check is in a backoff state due to rate limiting.
  • Errored: The health check configuration is incorrect or an error occurred during execution.

These states help you quickly understand the status of your health checks and take appropriate actions.

Bug Fixes for NotificationRules

We have also addressed several bugs related to NotificationRules. These fixes ensure that notifications are sent accurately and timely, enhancing the reliability of your monitoring setup.

Since the features are widely available with the release of version v0.4.0, there's no wait time. You can start enhancing your Kubernetes operations with these awesome updates immediately.

Why These Features Matter

Backoff Mechanism

The backoff mechanism ensures that your health checks are efficient and respectful of rate limits. It prevents unnecessary strain on your services and avoids potential problems for exceeding rate limits on your partners endpoints.

REST API Implementation

The REST API provides a convenient way to access health check statuses programmatically. This integration allows for more dynamic and automated responses to health check results, enhancing your application's resilience and reliability.

Check State

Having clear, distinct states for health checks helps in quickly diagnosing issues and understanding the current status of your services. Whether a check is active, in backoff, or errored, you have the information you need to take appropriate action.

Free Features for Our Community

One of the cornerstones of Cloudders is our commitment to the community. That's why we're particularly proud that these powerful new features are also free. We believe that robust health checks should be accessible to every Kubernetes user, and price should never be a barrier to amazing functionalities.

Cloudders is dedicated to making your transition to v0.4.0 as smooth as possible. With this upgrade, your health checking will not only be more robust but also more intuitive, aligning with best practices that the Kubernetes community expects and respects.

Get Started Now!

We at Cloudders are committed to providing you with industry-leading tools and features that make your Kubernetes management as straightforward and effective as possible. The introduction of the backoff mechanism, REST API, and check states in our Health Check Operator v0.4.0 is just another step towards that commitment.

So why wait? Embrace the new capabilities of your Kubernetes platform right away and set up your first enhanced health check today. Visit Cloudders's official documentation for more on how to get started with our latest features, and join the ranks of Kubernetes users who are step ahead in their operations game.

Thank you for entrusting your Kubernetes operations to Cloudders. We're excited to see how our latest features will propel your applications to greater reliability and performance!

· 5 min read

In a world that's ever-evolving, Cloudders is at the forefront of Kubernetes innovation, bringing you features that enhance the way you interact with Kubernetes. We're excited to announce a brand-new enhancement to our Kubernetes Health Check Operator—a tool that’s become essential for DevOps teams managing Kubernetes deployments.

Better Service Probes with TCP Health Checks

Our latest release, v0.3.0, introduces an update that takes our Custom Resource Definitions (CRDs) to a higher level of operational excellence. Now with the ability to include http or tcp sections, you can exert more control over your health checks. And the crown jewel? The actual new tcp checks.

TCP (Transmission Control Protocol) health checks are crucial for applications where establishing a proper TCP connection is a definitive indicator of the application's health. Before, you might have leveraged HTTP checks even if your service was primarily TCP-based—not anymore!

Seamless Integration

Implementing the new TCP Health Checks couldn't be easier. With just a few lines of YAML, you set up a HealthCheck that probes any TCP service. Here’s how you can quickly apply a TCP health check to your service using kubectl:

Example TCP health check
In the below example we will create a simple HealthCheck that probes TCP service on port 8080:

kubectl apply -f - <<EOF
apiVersion: check.cloudders.com/v1alpha1
kind: HealthCheck
metadata:
name: service-8080
spec:
tcp:
ipv4: "127.0.0.1"
port: 8080
EOF

Free Feature for Our Community

One of the cornerstones of Cloudders is our commitment to the community. That's why we're particularly proud that this new feature isn't just powerful—it's also free. We believe that robust health checks should be accessible to every Kubernetes user, and price should never be a barrier to high performance.

Since the feature is widely available with the release of version v0.3.0, there's no wait time. You can start enhancing your Kubernetes operations with these awesome TCP Health Checks immediately.

Why TCP Health Checks Matter

TCP checks open a direct line to the more nuanced aspects of your applications. An HTTP check might return a 200 OK status even when underlying TCP-dependent services are struggling. With direct TCP probes, you catch issues that HTTP checks might miss—before they escalate.

Imagine ensuring that your database, running on a non-HTTP protocol, is connected correctly, or confirming that your message broker on a custom TCP protocol is up and running without a hitch. TCP Health checks are more than just an update—they're an essential layer of insight.

Streamlined CRD Upgrade for Enhanced Health Checks

While we're introducing an exciting new feature with the TCP health checks, it's important to note that an upgrade path is required for existing Custom Resource Definitions (CRDs). For those who've been with us thus far, your existing CRDs might look like this:

apiVersion: check.cloudders.com/v1alpha1
kind: HealthCheck
metadata:
name: cloudders-docs-configuration
spec:
url: "https://cloudders.com/docs/configuration/notificationrule"
testInterval: 60
searchFor:
string: "on this documentation page"

In the above configuration, the health check is defined with a straightforward url field. With v0.3.0, we've refined our CRDs by adding new map fields http or tcp to better categorize and set up your health probes. The new CRD structure is more expressive and aligns with the Kubernetes standards for similar resource types.

Here's an example of what the new CRD should look like with an HTTP check:

apiVersion: check.cloudders.com/v1alpha1
kind: HealthCheck
metadata:
name: cloudders-docs-configuration
spec:
http:
url: "https://cloudders.com/docs/configuration/notificationrule"
testInterval: 60
searchFor:
string: "on this documentation page"

Note the introduction of the http field which now encompasses the url and searchFor properties. This change is not just cosmetic; it allows for greater flexibility and paves the way for more protocol-specific checks like our new TCP feature.

What You Need to Do

To take advantage of the new tcp and updated http health checks, users will need to update their CRDs to the new format. Here are the key steps:

  1. Review your existing HealthCheck CRDs.
  2. Adjust the spec to include either http or tcp fields, depending on the type of check you are implementing.
  3. Apply the updated HealthCheck CRD to your cluster.

We understand that changes to CRDs can be a significant move for many of our users, and we're here to help! Feel free to reach out to us if you encounter any issues.

Cloudders is dedicated to making your transition to v0.3.0 as smooth as possible. With this upgrade, your health checking will not only be more robust but also more intuitive, aligning with best practices that the Kubernetes community expects and respects.

Get Started Now!

We at Cloudders are committed to providing you with industry-leading tools and features that make your Kubernetes management as straightforward and effective as possible. The introduction of TCP health checks in our Health Check Operator v0.3.0 is just another step towards that commitment.

So why wait? Embrace the new capabilities of your Kubernetes platform right away and set up your first TCP health check today. Visit Cloudders's official documentation for more on how to get started with our latest features, and join the ranks of Kubernetes users who are step ahead in their operations game.

Thank you for entrusting your Kubernetes operations to Cloudders. We're excited to see how our latest features will propel your applications to greater reliability and performance!

· 3 min read
Yuliyan Tsvetkov

While our HealthCheck operator statuses are absolutely enough for most of the people, other love visualisations.

We have recently added a new section in our documentation where we explain the Monitoring integration of our Health Check operator with Prometheus and Grafana.

There is also an example Grafana dashboard you can modify for your needs in the Grafana section.

Grafana dashboard

In this blog post we will go over the different types of metrics and how we can use them in our advantage.

Metrics

Our operator exposes the following metrics:

  • healthcheck_response_codes: counter
  • healthcheck_response_time: gauge
  • healthcheck_status: gauge

Getting the Most from Your Metrics

Now that we have established the types of metrics our operator exposes, let's delve into how they can be utilized effectively.

  • healthcheck_response_codes: This counter type metric provides a wealth of data regarding the HTTP response codes received by the HealthCheck. Tracking and visualizing these codes over time can provide us insights into the behaviour and performance of the service being monitored. For instance, an unexpected increase in 4xx or 5xx codes could indicate issues with the target service.

In our Grafana dashboard, we can create panels to represent these metrics in a time series graph. We can also leverage Grafana's alerting system to set thresholds for specific response codes, sending notifications if these thresholds are breached.

  • healthcheck_response_time: A gauge metric like healthcheck_response_time gives us the ability to measure the responsiveness of the target. By tracking this over time, we can detect slowdowns or performance issues which may not result in total service failure but could degrade the user experience.

In Grafana, we can visualize this data using line charts or heatmaps. This would make it easier to spot trends or potential anomalies. Additionally, setting up alerts based on response time can help us take proactive measures before an issue escalates.

  • healthcheck_status: The healthcheck_status gauge is a simple yet effective way to monitor the availability of the target service. When the target is UP, it represents 1, and when it's DOWN, it's 0.

In our Grafana dashboard, we could use a single stat panel to represent the status of our service. With Grafana's alerting functionality, we could set up alerts to notify us when the status gauge hits 0, indicating that the service is down, or you can use our integrated NotificationRule CRD to setup alerts with Slack directly.

Conclusion

With the integration of Prometheus and Grafana with our Health Check Operator, we have a powerful and flexible system for monitoring our services. By fully utilising these metrics and understanding their potential, we can create dynamic and informative dashboards that not only give us visibility into our services but also enable us to proactively address issues.

We hope this blog post has given you some insights on how to best utilise these metrics with Grafana.

Don't hesitate to tweak and adapt the provided Grafana dashboard according to your needs. Happy monitoring!

· 3 min read
Yuliyan Tsvetkov

Hello Kubernetes enthusiasts and our amazing beta testers - the pioneers who were our first installers!

We're here with some updates regarding our Kubernetes Health Check Operator that took its first steps in the public space just couple of days ago.

We’ve been receiving a lot of queries about when we’ll be open sourcing our product. It’s heartening to see such interest, and we truly believe in the potential of open source to foster innovation and collaboration. We're excited by the prospect, but we want to share a few reasons why we're holding off, for now.

Quality Assurance

We're firm believers in quality over quantity. The product is still in its early stages and, as any parent would say, there's much room for it to grow and improve. We want to ensure that we present you with code that is mature and sturdy enough to be forked and reused in myriad ways. Our team is rigorously working to make sure that the software is resilient, reliable, and robust before we share it with the world.

Support Capacity

The open source software (OSS) community is vibrant, dynamic, and fast-paced. To play an active role in it, companies need to have the resources to provide support, respond to queries, fix bugs, and be open to contributions. At present, our bandwidth is spread thin over perfecting the product, and we don't want to promise something that we can't fully deliver. Rather than rushing to join the OSS community, we are focusing on building up our capacity to offer the level of support that you deserve.

Wrapping up: Good things take time

We understand that these are exciting times and we all want to jump straight into the deep end. Yet, the responsibility of ensuring that our product matches up to your expectations and serves as a useful tool in your arsenal is one we take very seriously. We want to get it right, and that takes time.

We are immensely grateful for your understanding and patience. Rest assured, we are as eager as you are to see our Kubernetes Health Check Operator thrive in the open source community. And we promise, the wait will be worth it.

Stay tuned for more updates, and keep those lines of feedback coming. You are the ones who inspire us to do better, to be better.

Thank you for your continuous support and belief in us.

The best is yet to come,
Yuli

· 4 min read
Yuliyan Tsvetkov

We are excited to launch our brand-new Kubernetes-native HealthCheck Operator! This powerful tool brings in-cluster health checks for HTTP(S) services right at your fingertips. What's even better? The free version comes with unlimited resources: you can create as many health checks and notification rules as you need.

It also seamlessly integrates with Prometheus, providing essential metrics like healthcheck_response_codes, healthcheck_response_time, and healthcheck_status.

A Deep Dive Into HealthCheck Operator

Our HealthCheck Operator is powered by two key Custom Resource Definitions (CRDs):

1. HealthCheck

The HealthCheck CRD performs checks on specified URLs at regular intervals. Here is an example:

apiVersion: check.cloudders.com/v1alpha1
kind: HealthCheck
metadata:
name: cloudders-check
spec:
url: "https://cloudders.com"
testInterval: 60
sslCheck:
expiration: 10
searchFor:
expression: "ope\w{2}tor"

In the HealthCheck CRD:

  • url: Specifies the URL that the health check is performed on.
  • testInterval: The interval, in seconds, at which the health check is conducted.
  • sslCheck: Checks the SSL certificate's validity, with expiration being the number of days left for the certificate to expire.
  • searchFor: Allows you to define a regular expression for search patterns in the response body.

2. NotificationRule

The NotificationRule CRD sets up rules for sending notifications via Slack when specified conditions are met. Here is an example:

apiVersion: check.cloudders.com/v1alpha1
kind: NotificationRule
metadata:
name: cloudders-alerts
spec:
checks:
- "cloudders-check"
slack:
webhook:
secret:
- name: slack-webhook
key: org1
username: "controller"
channel: "#general"
message: |
{
"color": "#FF0000",
"blocks": [...]
}
waitBeforeSend: 1
repeatAfter: 1

In the NotificationRule CRD:

  • checks: The name of the health checks associated with this rule.
  • slack: Defines the Slack settings for the webhook secret, username, and channel for notifications.
  • message: The message sent as a notification in Slack's message block format. It includes variables that are replaced with real-time data.
  • waitBeforeSend: The time in minutes that the system waits after a trigger condition before sending the alert.
  • repeatAfter: The time in minutes after which the alert should be sent again if the trigger condition is still met.

More than a Free Tool: An Enterprise Solution

Our commitment doesn't stop at providing a robust free version. We are thrilled to announce that a paid version, featuring even more advanced capabilities, is in the pipeline. Our mission is to offer scalable solutions tailored to businesses of all sizes. Therefore, even as we're perfecting our upcoming paid version, we're already offering enterprise-level support for our existing product.

Code Customization

We understand that your organization has unique needs and workflows. To ensure the HealthCheck Operator integrates seamlessly with your existing setup, our team is ready to assist with code customizations.

Priority Support

With priority support, your queries and issues move to the front of the line, ensuring faster response times and resolution.

Dedicated Account Management

Your organization will have a dedicated account manager who will understand your needs, assist you with onboarding and customization, and be your point of contact for any assistance you might need.

Training & Onboarding

To help your team get the most out of HealthCheck Operator, we offer training sessions. We'll walk you through the features, best practices, and provide in-depth technical training as needed.

Final Remarks: Embrace the Future of Health Checks with HealthCheck Operator

In the age of cloud-native technologies, we believe that health checks should be as robust and flexible as the rest of your tech stack. With the HealthCheck Operator, we're committed to providing a Kubernetes-native solution that meets these needs, regardless of your organization's size or complexity.

Stay tuned for more information on our upcoming paid version, and in the meantime, please don't hesitate to reach out with any questions or feedback about our free version. Your feedback helps shape our offerings, and we appreciate your support as we continually work to improve the HealthCheck Operator. Embrace the power of Kubernetes-native health checks with HealthCheck Operator today! Your operations team, your developers, and indeed, your whole organization will thank you.