
While our HealthCheck operator statuses are absolutely enough for most of the people, other love visualisations.
We have recently added a new section in our documentation where we explain the Monitoring integration of our Health Check operator with Prometheus and Grafana.
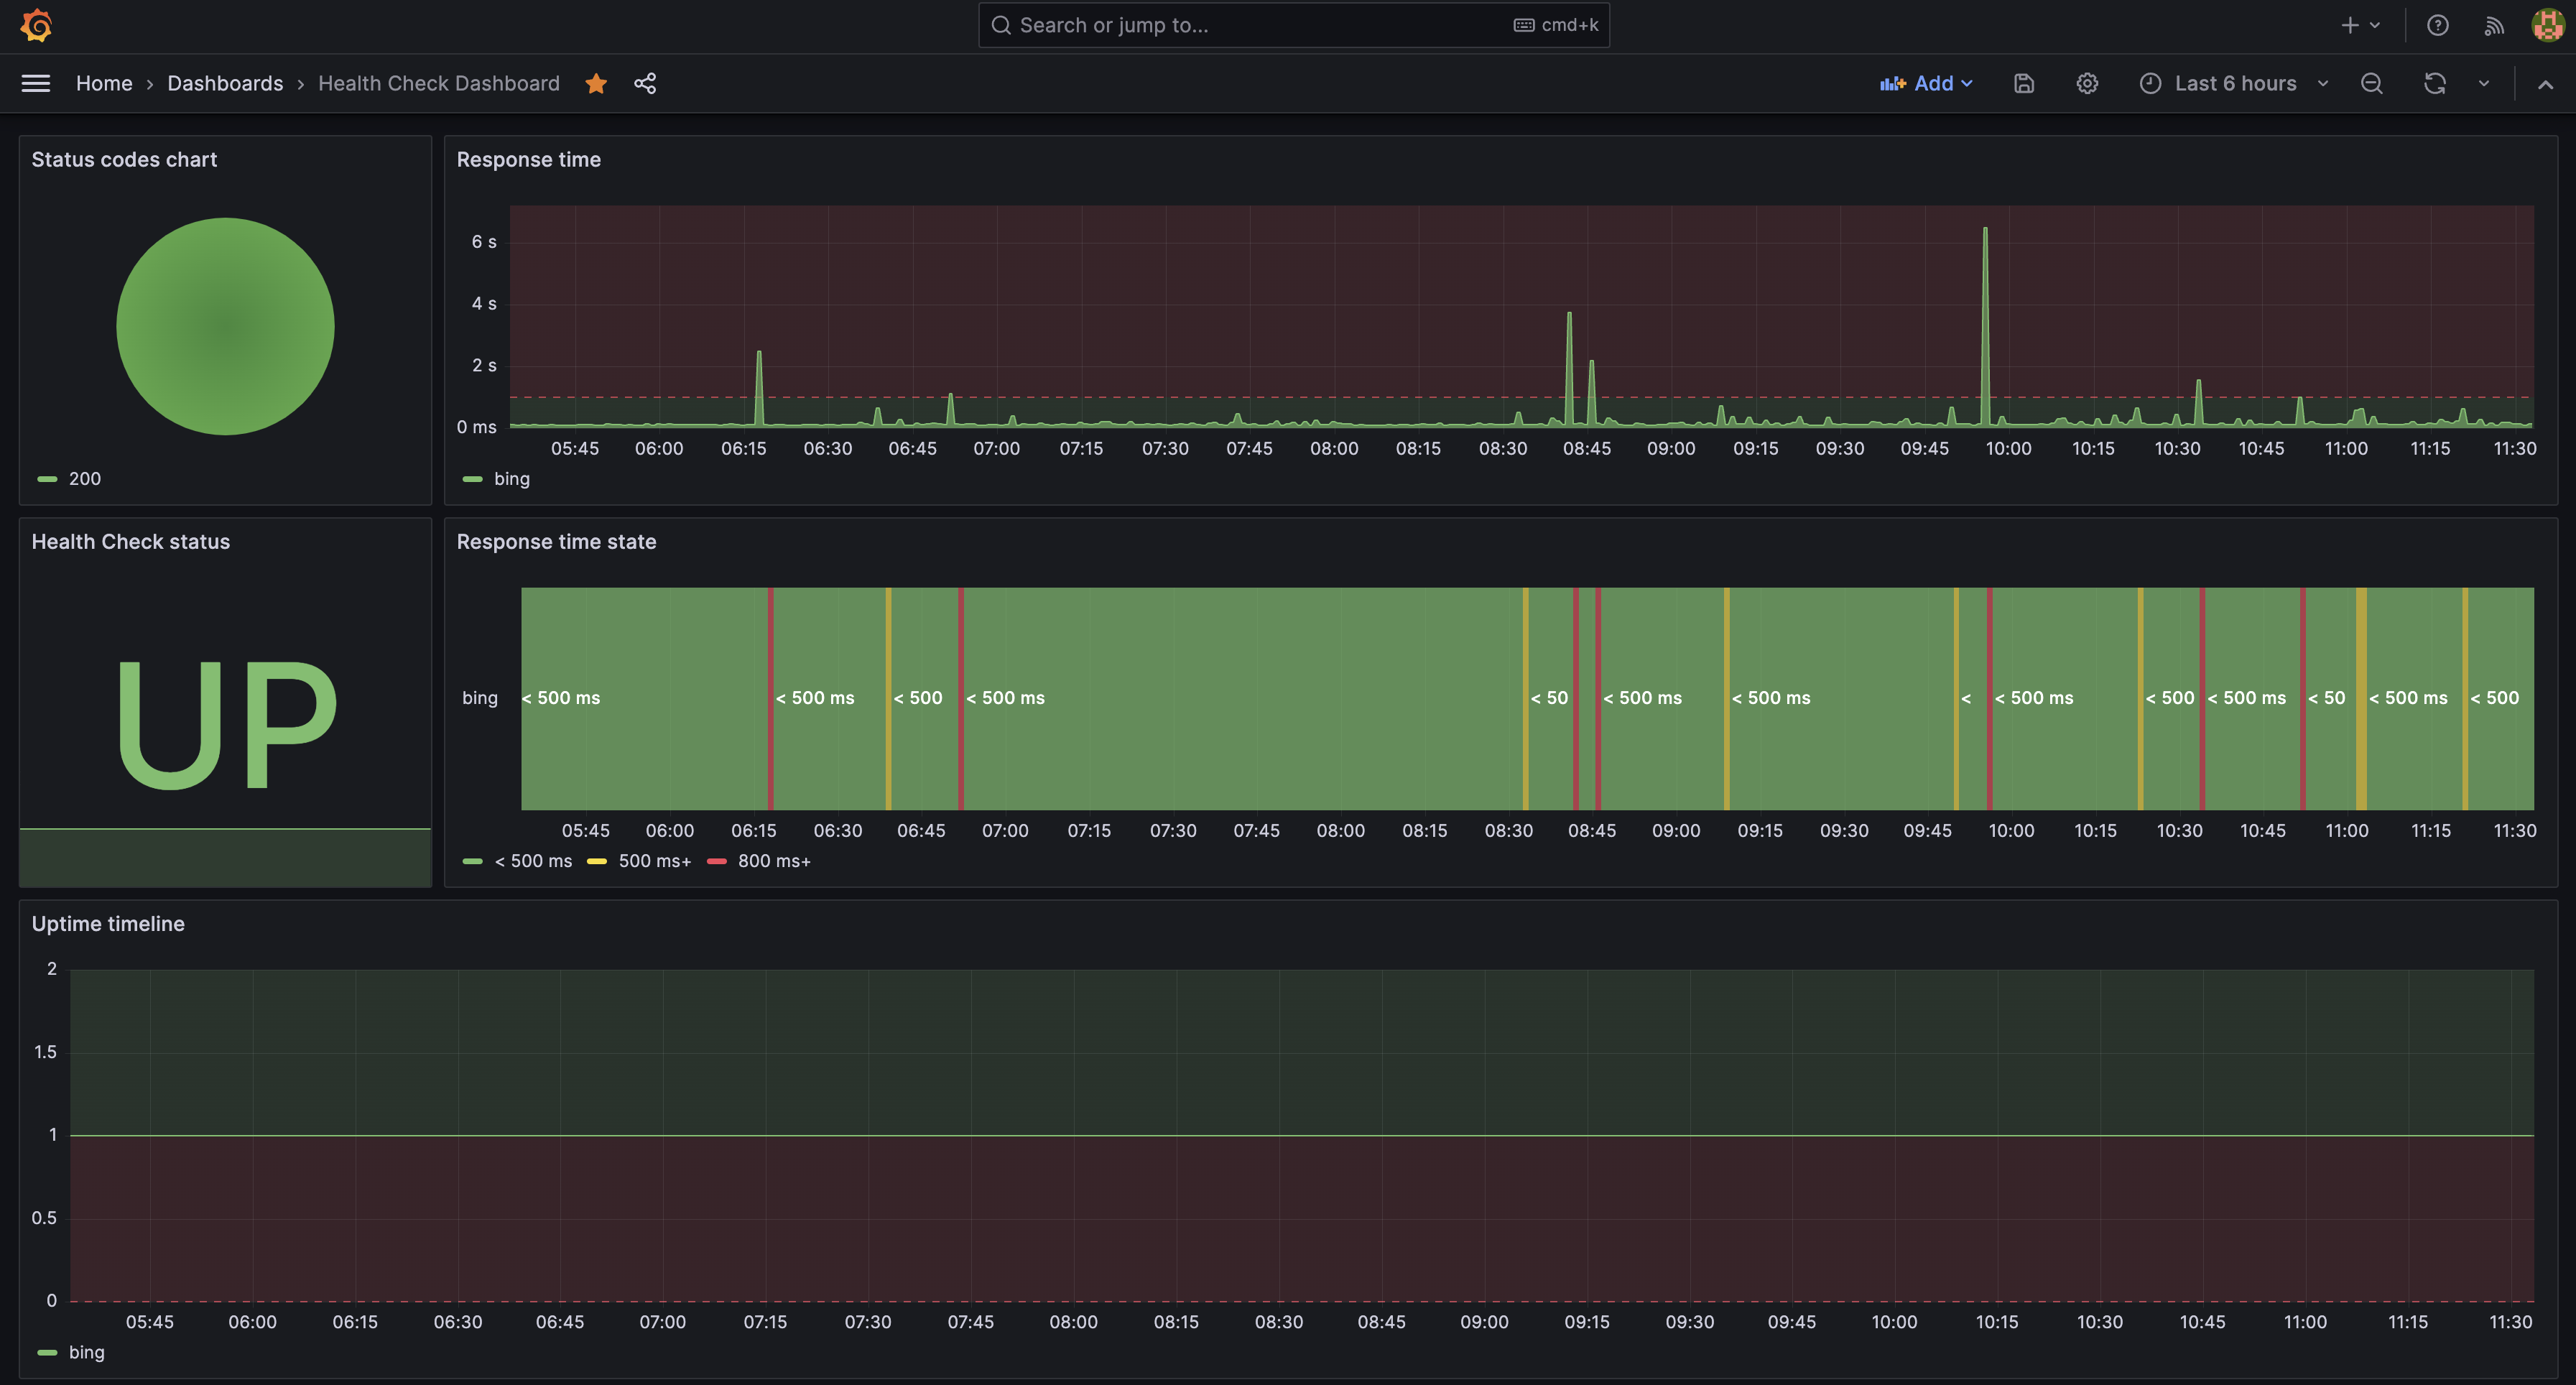
There is also an example Grafana dashboard you can modify for your needs in the Grafana section.
In this blog post we will go over the different types of metrics and how we can use them in our advantage.
Metrics
Our operator exposes the following metrics:
healthcheck_response_codes:counterhealthcheck_response_time:gaugehealthcheck_status:gauge
Getting the Most from Your Metrics
Now that we have established the types of metrics our operator exposes, let's delve into how they can be utilized effectively.
healthcheck_response_codes: This counter type metric provides a wealth of data regarding theHTTPresponse codes received by theHealthCheck. Tracking and visualizing these codes over time can provide us insights into the behaviour and performance of the service being monitored. For instance, an unexpected increase in4xxor5xxcodes could indicate issues with the target service.
In our Grafana dashboard, we can create panels to represent these metrics in a time series graph. We can also leverage Grafana's alerting system to set thresholds for specific response codes, sending notifications if these thresholds are breached.
healthcheck_response_time: A gauge metric like healthcheck_response_time gives us the ability to measure the responsiveness of the target. By tracking this over time, we can detect slowdowns or performance issues which may not result in total service failure but could degrade the user experience.
In Grafana, we can visualize this data using line charts or heatmaps. This would make it easier to spot trends or potential anomalies. Additionally, setting up alerts based on response time can help us take proactive measures before an issue escalates.
healthcheck_status: The healthcheck_status gauge is a simple yet effective way to monitor the availability of the target service. When the target is UP, it represents 1, and when it's DOWN, it's 0.
In our Grafana dashboard, we could use a single stat panel to represent the status of our service. With Grafana's alerting functionality, we could set up alerts to notify us when the status gauge hits 0, indicating that the service is down, or you can use our integrated NotificationRule CRD to setup alerts with Slack directly.
Conclusion
With the integration of Prometheus and Grafana with our Health Check Operator, we have a powerful and flexible system for monitoring our services. By fully utilising these metrics and understanding their potential, we can create dynamic and informative dashboards that not only give us visibility into our services but also enable us to proactively address issues.
We hope this blog post has given you some insights on how to best utilise these metrics with Grafana.
Don't hesitate to tweak and adapt the provided Grafana dashboard according to your needs. Happy monitoring!